Q4 Market Update: Tariffs, MWP & Aluminum Can Price Increase
The 50% aluminum tariff and shifting supply chains mean U.S. Midwest Premium (MWP) is rising. Craft beverage businesses should expect an average aluminum can price increase of approximately 3.2% this quarter.
Roughly one-third of your can price is raw aluminum, and two-thirds are non-metal inputs. So when raw aluminum moves 10.5%, that translates to approximately 3.2% at the can level. The tariff doesn't add a single line item, it ripples through the entire supply chain, pushing premiums higher as importers, warehouses, and logistics providers all adjust.
Want to check the current numbers yourself? Use the Cask Aluminum Calculator to find the current price of raw aluminum $/lb at any time. Super helpful for budgeting conversations.
Two-Year Tariff Impact: What the Numbers Actually Say
Over the past two years, tariffs pushed raw aluminum prices up nearly 60%. Average aluminum can prices have risen approximately 14% during the same period — not 60%. Can manufacturers absorb a significant portion of raw material volatility through operational efficiency, scale, and long-term contracts.
Of that 14% can price increase, tariffs contributed roughly 10% of the total hike, with normal inflation making up the rest. Here's how pricing has tracked across all major can formats:
| Format | Q1 '24 | Q2 '24 | Q3 '24 | Q4 '24 | Q1 '25 | Q2 '25 | Q3 '25 | Q4 '25 | 2 Yr |
|---|---|---|---|---|---|---|---|---|---|
| 12oz Std + End | -2.9% | -0.3% | 3.8% | -2.2% | 3.0% | 4.4% | 1.9% | 3.2% | 14.3% |
| 12oz Slk + End | -2.6% | -0.3% | 3.7% | -2.1% | 2.9% | 4.3% | 1.9% | 3.1% | 14.0% |
| 16oz Std + End | -3.4% | -0.3% | 3.8% | -2.2% | 3.0% | 4.5% | 2.0% | 3.2% | 14.5% |
| 19.2oz Std + End | -2.4% | -0.3% | 2.9% | -1.7% | 2.2% | 3.5% | 1.5% | 2.5% | 11.1% |
| Raw Aluminum | 0.7% | -1.5% | 16.3% | -8.4% | 11.2% | 15.6% | 6.7% | 10.5% | 59.1% |
A 14% increase over two years is real, but it's manageable when you see it in context alongside a 59% raw aluminum spike. Build it into your forecasts, account for continued MWP pressure, and know that the businesses locking in supply relationships now carry less risk into next year than those who wait.
Benchmarking Aluminum Can Prices Against Everyday Goods
Everyone's feeling price hikes at the checkout. Here's where aluminum can pricing sits relative to other goods that tariffs have hit over the past two years. Spoiler: cans are holding up better than your breakfast.
| 🥚 Eggs +96% |
🥩 Beef +14% |
🌾 Wheat +25% |
Aluminum cans? +14%. Right in line with beef, well below wheat, and a fraction of what eggs have done. That increase still hits your P&L, but it offers some useful perspective when you're explaining cost changes to stakeholders or adjusting retail pricing.
Can End Quality Trends: The Risk Craft Beverage Producers Might Not See Coming
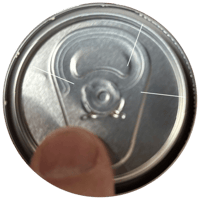
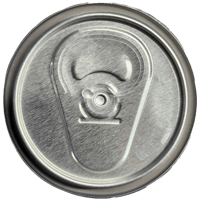
A Cask customer recently tackled a leaking can challenge after eliminating all operational variables by closely examining their aluminum can ends. They ran extensive testing with their current supply and used Ball Corporation ends as a control, identifying the sealing compound as the cause of failure.
| Current End Supply | Ball Corporation Ends |
| Faulty Ends (Major Blemishes) | Failure Rate |
| 34% Failure | 0% |
| Passable Ends (Minor Blemishes) | Sealant Blemishes |
| 8% Failure | None |
| *Sealing compound cause of failure | *Zero failures in independent testing |
 |
 |
With a 34% failure rate on can ends, one out of every three ends was compromising their seal and product quality. The cause was the sealing compound, not the seaming equipment or the operator.
This trend is worth watching closely because it's not always a deliberate supplier switch that causes it. Manufacturers are changing their supply chains and material compositions as costs and sourcing shift. You may be receiving a different product than you were six months ago without knowing it.
"We're seeing an increase of leaking cans. This often happens when customers unknowingly switch suppliers, but more recently because manufacturers are changing their supply chain or material composition. As costs and sourcing shift, strict QC is more important than ever. In our experience, Ball ends consistently show zero failure in independent tests, giving us and our customers confidence in their reliability. Regardless of your supplier, regular inspections and seam checks remain your best defense."Michael Slopek, Head of Customer Success — Cask Global Canning Solutions
What to Do Next: Protect Your Quality & Plan for 2026
Two actions craft beverage businesses can take right now. First, run QC checks on your can ends, especially if you're not certain where they're sourced from. Test against a known good control. If you're seeing leakers, start with the ends before disassembling your seaming equipment. Second, build the ~3.2% Q4 price increase into your 2026 forecasts and start planning supply now rather than reacting in January.
Cask Global Canning Solutions is a 25+ year Distribution Partner of Ball Corporation. We supply aluminum cans and lids to craft beverage businesses across the United States, Canada, and the United Kingdom. Our team can help you build a supply program that gives you confidence heading into next year.
If you're running into QC challenges or want to explore quality can supply options for 2026, we're here to help.